Range Breakout [sgbpulse]Range Breakout
1. Overview
The "Range Breakout " indicator is a powerful tool designed to identify and visually display price ranges on your chart using pivot points. It dynamically draws two distinct boxes – an External Range and an Internal Range – helping traders pinpoint potential support and resistance zones. Beyond its visual representation, the indicator offers a comprehensive set of 12 unique breakout alerts, providing real-time notifications for significant price movements outside these defined ranges. Additionally, it integrates RSI and MFI metrics for momentum confirmation.
2. How It Works
The indicator operates by identifying pivot points based on user-defined "left" and "right" bar lengths. A high pivot is a bar with a specified number of lower highs both to its left and right, and similarly for a low pivot.
External Range: Calculated using longer pivot lengths (default: 15 bars left, 6 bars right). This range represents broader, more significant price consolidation areas.
Internal Range: Calculated using shorter pivot lengths (default: 4 bars left, 3 bars right). This range captures tighter, more immediate price consolidations within the broader trend.
The External Range will always be greater than or equal to the Internal Range, as it's based on a wider historical context. Both ranges are displayed as transparent boxes on your chart, dynamically adjusting as new pivots are formed.
3. Key Features and Settings
Customizable Pivot Lengths:
External Range (Left/Right Bars): Adjust sensitivity for identifying the broader price range. Longer lengths lead to more stable, but less frequent, range updates.
Internal Range (Left/Right Bars): Adjust sensitivity for the tighter, more immediate price range.
Tool Tips: Minimum 6 bars for the External Range, and minimum 2 bars for the Internal Range.
Customizable Range Colors: Easily change the background colors of the External and Internal Range boxes to match your chart's aesthetic.
Dynamic Range Display: The indicator automatically updates the range boxes as new pivot highs and lows are formed, always presenting the most current valid ranges.
RSI / MFI Settings:
Timeframe Source: Select the timeframe for RSI and MFI calculation.
- Chart: Calculation based on the current chart timeframe.
- Daily: Always calculated based on the daily ("D") timeframe, even if the chart is on a lower timeframe.
RSI Length: Period length for RSI calculation (default: 14).
RSI Overbought Level: Overbought level for RSI (default: 70.0).
RSI Oversold Level: Oversold level for RSI (default: 30.0).
MFI Length: Period length for MFI calculation (default: 14).
MFI Overbought Level: Overbought level for MFI (default: 80.0).
MFI Oversold Level: Oversold level for MFI (default: 20.0).
4. Synergy of Ranges & Breakout Strength
The interaction between the External and Internal Ranges provides deep insights into price movement and breakout strength:
Immediate Direction: The movement of the Internal Range (up or down) indicates the short-term directional bias within the broader framework of the External Range.
Strength Confirmation: A breakout of the External Range, followed by a breakout of the Internal Range, confirms the strength of the move and increases confidence in the breakout.
Strong Momentum ("Leaving" Ranges Behind): When price breaks out with exceptionally strong momentum, it continues to move aggressively and does not immediately form new pivots. In such situations, the existing ranges (External and Internal) remain in place while the candles "leave them behind." A "Full Candle" breakout, where the entire candle moves past both ranges, indicates a particularly powerful and decisive move.
Momentum (RSI / MFI) as Confirmation:
- RSI (Relative Strength Index): Measures the speed and change of price movements. Extreme values (above 70 or below 30) indicate overbought/oversold conditions respectively, confirming strong momentum in a breakout.
- MFI (Money Flow Index): Similar to RSI but incorporates volume. Extreme values (above 80 or below 20) indicate strong money flow in/out, reinforcing breakout confirmation.
- Importance of Confirmation: If a breakout occurs but momentum indicators do not confirm it (for example, an upside breakout while RSI is declining), this could signal weakness in the move and the risk of a false breakout (Fakeout).
5. Visuals
The indicator provides clear visual representations on the chart:
Range Boxes:
Two dynamic boxes are drawn on the chart: one for the External Range and one for the Internal Range.
These boxes update continuously, displaying the current range boundaries based on the latest pivots. They provide an immediate visual indication of support and resistance levels.
RSI/MFI Status Labels:
Small text labels appear to the right of the current bar, vertically centered.
They display the status of RSI and MFI: RSI OB (Overbought), RSI OS (Oversold), MFI OB, MFI OS, along with the exact value.
Important: The labels remain on the chart as long as the condition holds (indicator is above/below the level), unlike alerts which mark a singular crossover event.
Plotting of Key Values:
The indicator plots six invisible series on the chart, primarily to allow the user to view the exact numerical values of:
- The upper and lower bounds of the External Range (External High, External Low).
- The upper and lower bounds of the Internal Range (Internal High, Internal Low).
- The calculated RSI and MFI values (RSI, MFI).
These values are accessible for viewing through TradingView's Data Window and also via the Status Line when hovering over the relevant candle. This enables more precise quantitative analysis of range levels and momentum.
6. Comprehensive Breakout Alerts
The "Range Breakout " indicator provides 12 distinct alert conditions for breakouts, allowing you to select the required level of confirmation for each alert. All alerts are triggered only upon a fully confirmed bar close (barstate.isconfirmed) to minimize false signals and ensure reliability.
All breakout alerts are configured to detect a Crossover/Crossunder of the levels, meaning a specific event where the price moves from one side of the range to the other.
External Range Breakout UP
- Close: Price closes above the External Range.
- Real Body: The entire "real body" of the candle (min of open/close prices) closes above the External Range.
- Full Candle: The entire candle (the lowest point of the candle) closes above the External Range.
External Range Breakout DOWN
- Close: Price closes below the External Range.
- Real Body: The entire "real body" of the candle (max of open/close prices) closes below the External Range.
- Full Candle: The entire candle (the highest point of the candle) closes below the External Range.
Internal Range Breakout UP
- Close: Price closes above the Internal Range.
- Real Body: The "real body" of the candle closes above the Internal Range.
- Full Candle: The entire candle closes above the Internal Range.
Internal Range Breakout DOWN
- Close: Price closes below the Internal Range.
- Real Body: The "real body" of the candle closes below the Internal Range.
- Full Candle: The entire candle closes below the Internal Range.
7. Ideal Use Cases
This indicator is ideal for traders who:
Want to clearly identify and monitor price consolidation zones.
Seek confirmation for breakout strategies across various timeframes.
Require reliable and automated alerts for potential entry or exit points based on range expansion.
8. Complementary Indicator
For even more comprehensive market analysis, we highly recommend using this indicator in conjunction with Market Structure Support & Resistance External/Internal & BoS .
This powerful complementary indicator automatically and accurately identifies significant support and resistance levels by locating high and low pivot points, as well as key Pre-Market High/Low levels. Its strength lies in its dynamic adaptability to any timeframe and asset, providing precise and relevant real-time levels while maintaining a clean chart. It also identifies Break of Structure (BoS) to signal potential trend changes or continuations.
Using both indicators together provides a robust framework for identifying defined ranges and potential trend shifts, enabling more informed trading decisions.
View Market Structure Support & Resistance External/Internal & BoS Indicator
9. Important Note: Trading Risk
This indicator is intended for educational and informational purposes only and does not constitute investment advice or a recommendation for trading in any form whatsoever.
Trading in financial markets involves significant risk of capital loss. It is important to remember that past performance is not indicative of future results. All trading decisions are your sole responsibility. Never trade with money you cannot afford to lose.
Cari dalam skrip untuk "relative strength"

Crypto Risk-Weighted Allocation SuiteCrypto Risk-Weighted Allocation Suite
This indicator is designed to help users explore dynamic portfolio allocation frameworks for the crypto market. It calculates risk-adjusted allocation weights across major crypto sectors and cash based on multi-factor momentum and volatility signals. Best viewed on INDEX:BTCUSD 1D chart. Other charts and timeframes may give mixed signals and incoherent allocations.
🎯 How It Works
This model systematically evaluates the relative strength of:
BTC Dominance (CRYPTOCAP:BTC.D)
Represents Bitcoin’s share of the total crypto market. Rising dominance typically indicates defensive market phases or BTC-led trends.
ETH/BTC Ratio (BINANCE:ETHBTC)
Gauges Ethereum’s relative performance versus Bitcoin. This provides insight into whether ETH is leading risk appetite.
SOL/BTC Ratio (BINANCE:SOLBTC)
Measures Solana’s performance relative to Bitcoin, capturing mid-cap layer-1 strength.
Total Market Cap excluding BTC and ETH (CRYPTOCAP:TOTAL3ES)
Represents Altcoins as a broad category, reflecting appetite for higher-risk assets.
Each of these series is:
✅ Converted to a momentum slope over a configurable lookback period.
✅ Standardized into Z-scores to normalize changes relative to recent behavior.
✅ Smoothed optionally using a Hull Moving Average for cleaner signals.
✅ Divided by ATR-based volatility to create a risk-weighted score.
✅ Scaled to proportionally allocate exposure, applying user-configured minimum and maximum constraints.
🪙 Dynamic Allocation Logic
All signals are normalized to sum to 100% if fully confident.
An overall confidence factor (based on total signal strength) scales the allocation up or down.
Any residual is allocated to cash (unallocated capital) for conservative exposure.
The script automatically avoids “all-in” bias and prevents negative allocations.
📊 Outputs
The indicator displays:
Market Phase Detection (which asset class is currently leading)
Risk Mode (Risk On, Neutral, Risk Off)
Dynamic Allocations for BTC, ETH, SOL, Alts, and Cash
Optional momentum plots for transparency
🧠 Why This Is Unique
Unlike simple dominance indicators or crossovers, this model:
Integrates multiple cross-asset signals (BTC, ETH, SOL, Alts)
Adjusts exposure proportionally to signal strength
Normalizes by volatility, dynamically scaling risk
Includes configurable constraints to reflect your own risk tolerance
Provides a cash fallback allocation when conviction is low
Is entirely non-repainting and based on daily closing data
⚠️ Disclaimer
This script is provided for educational and informational purposes only.
It is not financial advice and should not be relied upon to make investment decisions.
Past performance does not guarantee future results.
Always consult a qualified financial advisor before acting on any information derived from this tool.
🛠 Recommended Use
As a framework to visualize relative momentum and risk-adjusted allocations
For research and backtesting ideas on portfolio allocation across crypto sectors
To help build your own risk management process
This script is not a turnkey strategy and should be customized to fit your goals.
✅ Enjoy exploring dynamic crypto allocations responsibly!

Bear Market Probability Model# Bear Market Probability Model: A Multi-Factor Risk Assessment Framework
The Bear Market Probability Model represents a comprehensive quantitative framework for assessing systemic market risk through the integration of 13 distinct risk factors across four analytical categories: macroeconomic indicators, technical analysis factors, market sentiment measures, and market breadth metrics. This indicator synthesizes established financial research methodologies to provide real-time probabilistic assessments of impending bear market conditions, offering institutional-grade risk management capabilities to retail and professional traders alike.
## Theoretical Foundation
### Historical Context of Bear Market Prediction
Bear market prediction has been a central focus of financial research since the seminal work of Dow (1901) and the subsequent development of technical analysis theory. The challenge of predicting market downturns gained renewed academic attention following the market crashes of 1929, 1987, 2000, and 2008, leading to the development of sophisticated multi-factor models.
Fama and French (1989) demonstrated that certain financial variables possess predictive power for stock returns, particularly during market stress periods. Their three-factor model laid the groundwork for multi-dimensional risk assessment, which this indicator extends through the incorporation of real-time market microstructure data.
### Methodological Framework
The model employs a weighted composite scoring methodology based on the theoretical framework established by Campbell and Shiller (1998) for market valuation assessment, extended through the incorporation of high-frequency sentiment and technical indicators as proposed by Baker and Wurgler (2006) in their seminal work on investor sentiment.
The mathematical foundation follows the general form:
Bear Market Probability = Σ(Wi × Ci) / ΣWi × 100
Where:
- Wi = Category weight (i = 1,2,3,4)
- Ci = Normalized category score
- Categories: Macroeconomic, Technical, Sentiment, Breadth
## Component Analysis
### 1. Macroeconomic Risk Factors
#### Yield Curve Analysis
The inclusion of yield curve inversion as a primary predictor follows extensive research by Estrella and Mishkin (1998), who demonstrated that the term spread between 3-month and 10-year Treasury securities has historically preceded all major recessions since 1969. The model incorporates both the 2Y-10Y and 3M-10Y spreads to capture different aspects of monetary policy expectations.
Implementation:
- 2Y-10Y Spread: Captures market expectations of monetary policy trajectory
- 3M-10Y Spread: Traditional recession predictor with 12-18 month lead time
Scientific Basis: Harvey (1988) and subsequent research by Ang, Piazzesi, and Wei (2006) established the theoretical foundation linking yield curve inversions to economic contractions through the expectations hypothesis of the term structure.
#### Credit Risk Premium Assessment
High-yield credit spreads serve as a real-time gauge of systemic risk, following the methodology established by Gilchrist and Zakrajšek (2012) in their excess bond premium research. The model incorporates the ICE BofA High Yield Master II Option-Adjusted Spread as a proxy for credit market stress.
Threshold Calibration:
- Normal conditions: < 350 basis points
- Elevated risk: 350-500 basis points
- Severe stress: > 500 basis points
#### Currency and Commodity Stress Indicators
The US Dollar Index (DXY) momentum serves as a risk-off indicator, while the Gold-to-Oil ratio captures commodity market stress dynamics. This approach follows the methodology of Akram (2009) and Beckmann, Berger, and Czudaj (2015) in analyzing commodity-currency relationships during market stress.
### 2. Technical Analysis Factors
#### Multi-Timeframe Moving Average Analysis
The technical component incorporates the well-established moving average convergence methodology, drawing from the work of Brock, Lakonishok, and LeBaron (1992), who provided empirical evidence for the profitability of technical trading rules.
Implementation:
- Price relative to 50-day and 200-day simple moving averages
- Moving average convergence/divergence analysis
- Multi-timeframe MACD assessment (daily and weekly)
#### Momentum and Volatility Analysis
The model integrates Relative Strength Index (RSI) analysis following Wilder's (1978) original methodology, combined with maximum drawdown analysis based on the work of Magdon-Ismail and Atiya (2004) on optimal drawdown measurement.
### 3. Market Sentiment Factors
#### Volatility Index Analysis
The VIX component follows the established research of Whaley (2009) and subsequent work by Bekaert and Hoerova (2014) on VIX as a predictor of market stress. The model incorporates both absolute VIX levels and relative VIX spikes compared to the 20-day moving average.
Calibration:
- Low volatility: VIX < 20
- Elevated concern: VIX 20-25
- High fear: VIX > 25
- Panic conditions: VIX > 30
#### Put-Call Ratio Analysis
Options flow analysis through put-call ratios provides insight into sophisticated investor positioning, following the methodology established by Pan and Poteshman (2006) in their analysis of informed trading in options markets.
### 4. Market Breadth Factors
#### Advance-Decline Analysis
Market breadth assessment follows the classic work of Fosback (1976) and subsequent research by Brown and Cliff (2004) on market breadth as a predictor of future returns.
Components:
- Daily advance-decline ratio
- Advance-decline line momentum
- McClellan Oscillator (Ema19 - Ema39 of A-D difference)
#### New Highs-New Lows Analysis
The new highs-new lows ratio serves as a market leadership indicator, based on the research of Zweig (1986) and validated in academic literature by Zarowin (1990).
## Dynamic Threshold Methodology
The model incorporates adaptive thresholds based on rolling volatility and trend analysis, following the methodology established by Pagan and Sossounov (2003) for business cycle dating. This approach allows the model to adjust sensitivity based on prevailing market conditions.
Dynamic Threshold Calculation:
- Warning Level: Base threshold ± (Volatility × 1.0)
- Danger Level: Base threshold ± (Volatility × 1.5)
- Bounds: ±10-20 points from base threshold
## Professional Implementation
### Institutional Usage Patterns
Professional risk managers typically employ multi-factor bear market models in several contexts:
#### 1. Portfolio Risk Management
- Tactical Asset Allocation: Reducing equity exposure when probability exceeds 60-70%
- Hedging Strategies: Implementing protective puts or VIX calls when warning thresholds are breached
- Sector Rotation: Shifting from growth to defensive sectors during elevated risk periods
#### 2. Risk Budgeting
- Value-at-Risk Adjustment: Incorporating bear market probability into VaR calculations
- Stress Testing: Using probability levels to calibrate stress test scenarios
- Capital Requirements: Adjusting regulatory capital based on systemic risk assessment
#### 3. Client Communication
- Risk Reporting: Quantifying market risk for client presentations
- Investment Committee Decisions: Providing objective risk metrics for strategic decisions
- Performance Attribution: Explaining defensive positioning during market stress
### Implementation Framework
Professional traders typically implement such models through:
#### Signal Hierarchy:
1. Probability < 30%: Normal risk positioning
2. Probability 30-50%: Increased hedging, reduced leverage
3. Probability 50-70%: Defensive positioning, cash building
4. Probability > 70%: Maximum defensive posture, short exposure consideration
#### Risk Management Integration:
- Position Sizing: Inverse relationship between probability and position size
- Stop-Loss Adjustment: Tighter stops during elevated risk periods
- Correlation Monitoring: Increased attention to cross-asset correlations
## Strengths and Advantages
### 1. Comprehensive Coverage
The model's primary strength lies in its multi-dimensional approach, avoiding the single-factor bias that has historically plagued market timing models. By incorporating macroeconomic, technical, sentiment, and breadth factors, the model provides robust risk assessment across different market regimes.
### 2. Dynamic Adaptability
The adaptive threshold mechanism allows the model to adjust sensitivity based on prevailing volatility conditions, reducing false signals during low-volatility periods and maintaining sensitivity during high-volatility regimes.
### 3. Real-Time Processing
Unlike traditional academic models that rely on monthly or quarterly data, this indicator processes daily market data, providing timely risk assessment for active portfolio management.
### 4. Transparency and Interpretability
The component-based structure allows users to understand which factors are driving risk assessment, enabling informed decision-making about model signals.
### 5. Historical Validation
Each component has been validated in academic literature, providing theoretical foundation for the model's predictive power.
## Limitations and Weaknesses
### 1. Data Dependencies
The model's effectiveness depends heavily on the availability and quality of real-time economic data. Federal Reserve Economic Data (FRED) updates may have lags that could impact model responsiveness during rapidly evolving market conditions.
### 2. Regime Change Sensitivity
Like most quantitative models, the indicator may struggle during unprecedented market conditions or structural regime changes where historical relationships break down (Taleb, 2007).
### 3. False Signal Risk
Multi-factor models inherently face the challenge of balancing sensitivity with specificity. The model may generate false positive signals during normal market volatility periods.
### 4. Currency and Geographic Bias
The model focuses primarily on US market indicators, potentially limiting its effectiveness for global portfolio management or non-USD denominated assets.
### 5. Correlation Breakdown
During extreme market stress, correlations between risk factors may increase dramatically, reducing the model's diversification benefits (Forbes and Rigobon, 2002).
## References
Akram, Q. F. (2009). Commodity prices, interest rates and the dollar. Energy Economics, 31(6), 838-851.
Ang, A., Piazzesi, M., & Wei, M. (2006). What does the yield curve tell us about GDP growth? Journal of Econometrics, 131(1-2), 359-403.
Baker, M., & Wurgler, J. (2006). Investor sentiment and the cross‐section of stock returns. The Journal of Finance, 61(4), 1645-1680.
Baker, S. R., Bloom, N., & Davis, S. J. (2016). Measuring economic policy uncertainty. The Quarterly Journal of Economics, 131(4), 1593-1636.
Barber, B. M., & Odean, T. (2001). Boys will be boys: Gender, overconfidence, and common stock investment. The Quarterly Journal of Economics, 116(1), 261-292.
Beckmann, J., Berger, T., & Czudaj, R. (2015). Does gold act as a hedge or a safe haven for stocks? A smooth transition approach. Economic Modelling, 48, 16-24.
Bekaert, G., & Hoerova, M. (2014). The VIX, the variance premium and stock market volatility. Journal of Econometrics, 183(2), 181-192.
Brock, W., Lakonishok, J., & LeBaron, B. (1992). Simple technical trading rules and the stochastic properties of stock returns. The Journal of Finance, 47(5), 1731-1764.
Brown, G. W., & Cliff, M. T. (2004). Investor sentiment and the near-term stock market. Journal of Empirical Finance, 11(1), 1-27.
Campbell, J. Y., & Shiller, R. J. (1998). Valuation ratios and the long-run stock market outlook. The Journal of Portfolio Management, 24(2), 11-26.
Dow, C. H. (1901). Scientific stock speculation. The Magazine of Wall Street.
Estrella, A., & Mishkin, F. S. (1998). Predicting US recessions: Financial variables as leading indicators. Review of Economics and Statistics, 80(1), 45-61.
Fama, E. F., & French, K. R. (1989). Business conditions and expected returns on stocks and bonds. Journal of Financial Economics, 25(1), 23-49.
Forbes, K. J., & Rigobon, R. (2002). No contagion, only interdependence: measuring stock market comovements. The Journal of Finance, 57(5), 2223-2261.
Fosback, N. G. (1976). Stock market logic: A sophisticated approach to profits on Wall Street. The Institute for Econometric Research.
Gilchrist, S., & Zakrajšek, E. (2012). Credit spreads and business cycle fluctuations. American Economic Review, 102(4), 1692-1720.
Harvey, C. R. (1988). The real term structure and consumption growth. Journal of Financial Economics, 22(2), 305-333.
Kahneman, D., & Tversky, A. (1979). Prospect theory: An analysis of decision under risk. Econometrica, 47(2), 263-291.
Magdon-Ismail, M., & Atiya, A. F. (2004). Maximum drawdown. Risk, 17(10), 99-102.
Nickerson, R. S. (1998). Confirmation bias: A ubiquitous phenomenon in many guises. Review of General Psychology, 2(2), 175-220.
Pagan, A. R., & Sossounov, K. A. (2003). A simple framework for analysing bull and bear markets. Journal of Applied Econometrics, 18(1), 23-46.
Pan, J., & Poteshman, A. M. (2006). The information in option volume for future stock prices. The Review of Financial Studies, 19(3), 871-908.
Taleb, N. N. (2007). The black swan: The impact of the highly improbable. Random House.
Whaley, R. E. (2009). Understanding the VIX. The Journal of Portfolio Management, 35(3), 98-105.
Wilder, J. W. (1978). New concepts in technical trading systems. Trend Research.
Zarowin, P. (1990). Size, seasonality, and stock market overreaction. Journal of Financial and Quantitative Analysis, 25(1), 113-125.
Zweig, M. E. (1986). Winning on Wall Street. Warner Books.

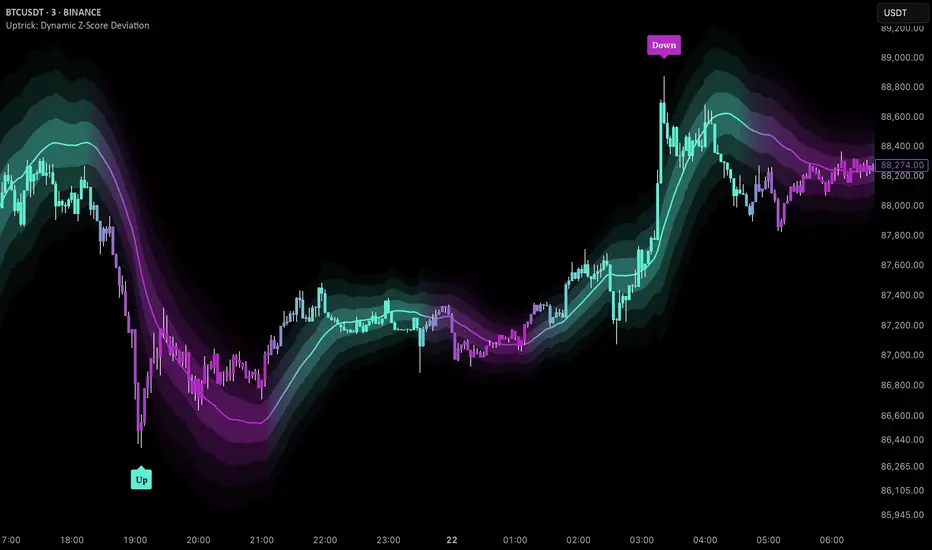
Uptrick: Dynamic Z-Score DeviationOverview
Uptrick: Dynamic Z‑Score Deviation is a trading indicator built in Pine Script that combines statistical filters and adaptive smoothing to highlight potential reversal points in price action. It combines a hybrid moving average, dual Z‑Score analysis on both price and RSI, and visual enhancements like slope‑based coloring, ATR‑based shadow bands, and dynamically scaled reversal signals.
Introduction
Statistical indicators like Z‑Scores measure how far a value deviates from its average relative to the typical variation (standard deviation). Standard deviation quantifies how dispersed a set of values is around its mean. A Z‑Score of +2 indicates a value two standard deviations above the mean, while -2 is two below. Traders use Z‑Scores to spot unusually high or low readings that may signal overbought or oversold conditions.
Moving averages smooth out price data to reveal trends. The Arnaud Legoux Moving Average (ALMA) reduces lag and noise through weighted averaging. A Zero‑Lag EMA (approximated here using a time‑shifted EMA) seeks to further minimize delay in following price. The RSI (Relative Strength Index) is a momentum oscillator that measures recent gains against losses over a set period.
ATR (Average True Range) gauges market volatility by averaging the range between high and low over a lookback period. Shadow bands built using ATR give a visual mood of volatility around a central trend line. Together, these tools inform a dynamic but statistically grounded view of market extremes.
Purpose
The main goal of this indicator is to help traders spot short‑term reversal opportunities on lower timeframes. By requiring both price and momentum (RSI) to exhibit statistically significant deviations from their norms, it filters out weak setups and focuses on higher‑probability mean‑reversion zones. Reversal signals appear when price deviates far enough from its hybrid moving average and RSI deviates similarly in the same direction. This makes it suitable for discretionary traders seeking clean entry cues in volatile environments.
Originality and Uniqueness
Uptrick: Dynamic Z‑Score Deviation distinguishes itself from standard reversal or mean‑reversion tools by combining several elements into a single framework:
A composite moving average (ALMA + Zero‑Lag EMA) for a smooth yet responsive baseline
Dual Z‑Score filters on price and RSI rather than relying on a single measure
Adaptive visual elements, including slope‑aware coloring, multi‑layer ATR shadows, and signal sizing based on combined Z‑Score magnitude
Most indicators focus on one aspect—price envelopes or RSI thresholds—whereas Uptrick: Dynamic Z‑Score Deviation requires both layers to align before signaling. Its visual design aids quick interpretation without overwhelming the chart.
Why these indicators were merged
Every component in Uptrick: Dynamic Z‑Score Deviation has a purpose:
• ALMA: provides a smooth moving average with reduced lag and fewer false crossovers than a simple SMA or EMA.
• Zero‑Lag EMA (ZLMA approximation): further reduces the delay relative to price by applying a time shift to EMA inputs. This keeps the composite MA closer to current price action.
• RSI and its EMA filter: RSI measures momentum. Applying an EMA filter on RSI smooths out false spikes and confirms genuine overbought or oversold momentum.
• Dual Z‑Scores: computing Z‑Scores on both the distance between price and the composite MA, and on smoothed RSI, ensures that signals only fire when both price and momentum are unusually stretched.
• ATR bands: using ATR‑based shadow layers visualizes volatility around the MA, guiding traders on potential support and resistance zones.
At the end, these pieces merge into a single indicator that detects statistically significant mean reversions while staying adaptive to real‑time volatility and momentum.
Calculations
1. Compute ALMA over the chosen MA length, offset, and sigma.
2. Approximate ZLMA by applying EMA to twice the price minus the price shifted by the MA length.
3. Calculate the composite moving average as the average of ALMA and ZLMA.
4. Compute raw RSI and smooth it with ALMA. Apply an EMA filter to raw RSI to reduce noise.
5. For both price and smoothed RSI, calculate the mean and standard deviation over the Z‑Score lookback period.
6. Compute Z‑Scores:
• z_price = (current price − composite MA mean) / standard deviation of price deviations
• z_rsi = (smoothed RSI − mean RSI) / standard deviation of RSI
7. Determine reversal conditions: both Z‑Scores exceed their thresholds in the same direction, RSI EMA is in oversold/overbought zones (below 40 or above 60), and price movement confirms directionality.
8. Compute signal strength as the sum of the absolute Z‑Scores, then classify into weak, medium, or strong.
9. Calculate ATR over the chosen period and multiply by layer multipliers to form shadow widths.
10.Derive slope over the chosen slope length and color the MA line and bars based on direction, optionally smoothing color transitions via EMA on RGB channels.
How this indicator actually works
1. The script begins by smoothing price data with ALMA and approximating a zero‑lag EMA, then averaging them for the main MA.
2. RSI is calculated, then smoothed and filtered.
3. Using a rolling window, the script computes statistical measures for both price deviations and RSI.
4. Z‑Scores tell how far current values lie from their recent norms.
5. When both Z‑Scores cross configured thresholds and momentum conditions align, reversal signals are flagged.
6. Signals are drawn with size and color reflecting strength.
7. The MA is plotted with dynamic coloring; ATR shadows are layered beneath to show volatility envelopes.
8. Bars can be colored to match MA slope, reinforcing trend context.
9. Alert conditions allow automated notifications when signals occur.
Inputs
Main Length: Main MA Length. Sets the period for ALMA and ZLMA.
RSI Length: RSI Length. Determines the lookback for momentum calculations.
Z-Score Lookback: Z‑Score Lookback. Window for mean and standard deviation computations.
Price Z-Score Threshold: Price Z‑Score Threshold. Minimum deviation required for price.
RSI Z-Score threshold: RSI Z‑Score Threshold. Minimum deviation required for momentum.
RSI EMA Filter Length: RSI EMA Filter Length. Smooths raw RSI readings.
ALMA Offset: Controls ALMA’s focal point in the window.
ALMA Sigma: Adjusts ALMA’s smoothing strength.
Show Reversal Signals : Toggle to display reversal signal markers.
Slope Sensitivity: Length for slope calculation. Higher values smooth slope changes.
Use Bar Coloring: Enables coloring of price bars based on MA slope.
Show MA Shadow: Toggle for ATR‑based shadow bands.
Shadow Layer Count: Number of shadow layers (1–4).
Base Shadow ATR Multiplier: Multiplier for ATR when sizing the first band.
Smooth Color Transitions (boolean): Smooths RGB transitions for line and shadows, if enabled.
ATR Length for Shadow: ATR Period for computing volatility bands.
Use Dynamic Signal Size: Toggles dynamic scaling of reversal symbols.
Features
Moving average smoothing: a hybrid of ALMA and Zero‑Lag EMA that balances responsiveness and noise reduction.
Slope coloring: MA line and optionally price bars change color based on trend direction; color transitions can be smoothed for visual continuity.
ATR shadow layers: translucent bands around the MA show volatility envelopes; up to four concentric layers help gauge distance from normal price swings.
Dual Z‑Score filters: price and momentum must both deviate beyond thresholds to trigger signals, reducing false positives.
Dynamic signal sizing: reversal markers scale in size based on the combined Z‑Score magnitude, making stronger signals more prominent.
Adaptive visuals: optional smoothing of color channels creates gradient effects on lines and fills for a polished look.
Alert conditions: built‑in buy and sell alerts notify traders when reversal setups emerge.
Conclusion
Uptrick: Dynamic Z‑Score Deviation delivers a structured way to identify short‑term reversal opportunities by fusing statistical rigor with adaptive smoothing and clear visual cues. It guides traders through multiple confirmation layers—hybrid moving average, dual Z‑Score analysis, momentum filtering, and volatility envelopes—while keeping the chart clean and informative.
Disclaimer
This indicator is provided for informational and educational purposes only and does not constitute financial advice. Trading carries risk and may not be suitable for all participants. Past performance is not indicative of future results. Always do your own analysis and risk management before making trading decisions.
Compare Strength with SLOPE Description
This indicator compares the relative strength between the current asset and a benchmark (e.g., BTC vs. ETH or AAPL vs. SPY) using a linear regression slope of their ratio over time.
The ratio is calculated as: close / benchmark
A linear regression slope is computed over a user-defined window
The slope represents trend strength: if it’s rising, the current asset is outperforming the benchmark
Plots
Gray Line: The raw ratio between the asset and benchmark
Orange Line: The slope of the ratio (shows momentum)
Background Color :
Green: The asset is significantly stronger than the benchmark
Red: The asset is significantly weaker than the benchmark
No color: No clear trend
Settings
Slope Window Length: Number of candles used in the regression (default = 10)
Slope Threshold: Sensitivity of trend detection. Smaller values detect weaker trends.
Example Use Cases
Style Rotation Strategy: Use the slope to determine whether "Growth" or "Value" style is leading.
Pair Trading / Relative Performance: Track which asset is leading in a pair (e.g., BTC vs ETH).
Factor Timing: Serve as a timing model to allocate between different sectors or factors.
Happy trading!

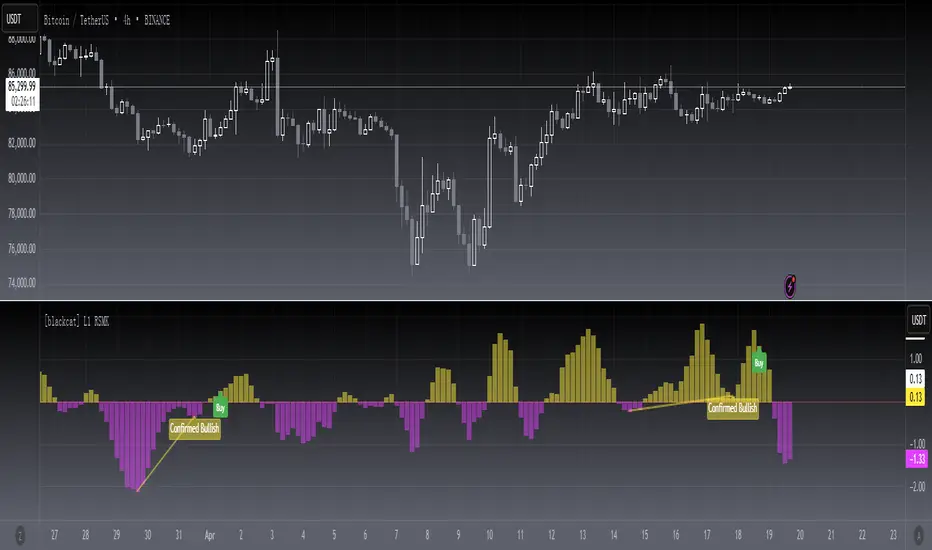
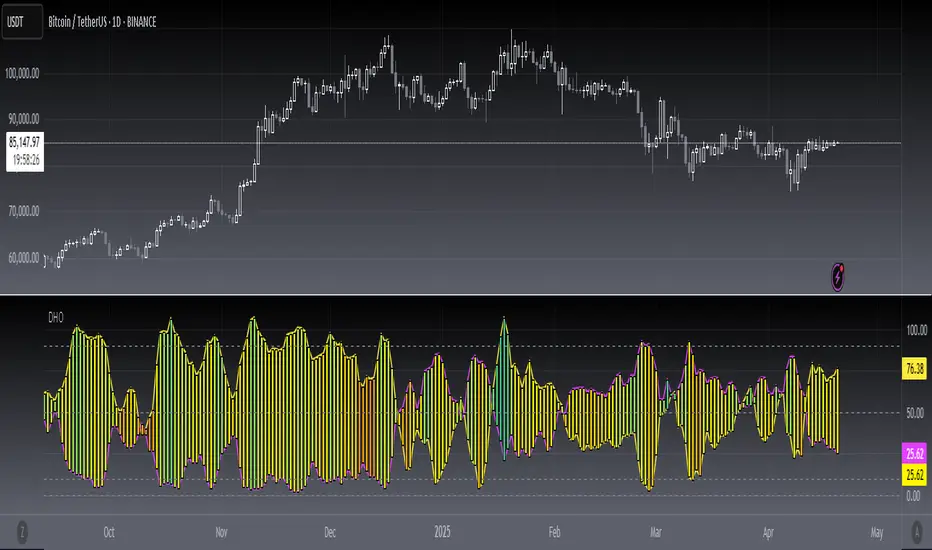
[blackcat] L3 Dark Horse OscillatorOVERVIEW
The L3 Dark Horse Oscillator is a sophisticated technical indicator meticulously crafted to offer traders deep insights into market momentum. By leveraging advanced calculations involving Relative Strength Value (RSV) and proprietary oscillatory techniques, this script provides clear and actionable signals for identifying potential buying and selling opportunities. Its distinctive feature—a vibrant gradient color scheme—enhances readability and makes it easier to visualize trends and reversals on the chart 📈↗️.
FEATURES
Advanced Calculation Methods: Utilizes complex algorithms to compute the Relative Strength Value (RSV) over specific periods, providing a nuanced view of price movements.
Default Period: 27 bars for initial RSV calculation.
Additional Period: 36 bars for extended RSV analysis.
Dual-Oscillator Components:
Component A: Derived using multiple layers of Simple Moving Averages (SMAs) applied to the RSV, offering a smoothed representation of short-term momentum.
Component B: Employs a unique averaging method tailored to capture medium-term trends effectively.
Dynamic Gradient Color Scheme: Enhances visualization through a spectrum of colors that change dynamically based on the calculated values, making trend identification intuitive and engaging 🌈.
Customizable Horizontal Reference Lines: Key levels are marked at 0, 10, 50, and 90 to serve as benchmarks for assessing the oscillator's readings, helping traders make informed decisions quickly.
Comprehensive Visual Representation: Combines the strengths of both components into a single, gradient-colored candlestick plot, providing a holistic view of market sentiment and momentum shifts 📊.
HOW TO USE
Adding the Indicator: Start by adding the L3 Dark Horse Oscillator to your TradingView chart via the indicators menu. This will overlay the necessary plots directly onto your price chart.
Interpreting the Components: Familiarize yourself with the two primary components represented by yellow and fuchsia lines. These lines indicate the underlying momentum derived from the RSV calculations.
Monitoring Momentum Shifts: Pay close attention to the gradient-colored candlesticks, which reflect the combined strength of both components. Notice how these candles transition through various shades, signaling changes in market dynamics.
Utilizing Reference Levels: Leverage the horizontal lines at 0, 10, 50, and 90 as critical thresholds. For instance, values above 50 might suggest bullish conditions, while those below could hint at bearish tendencies.
Combining with Other Tools: To enhance reliability, integrate this indicator with complementary technical analyses such as moving averages, volume profiles, or other oscillators like RSI or MACD.
LIMITATIONS
Market Volatility: In extremely volatile or sideways-trending markets, the indicator might produce false signals due to erratic price movements. Always cross-reference with broader market contexts.
Testing Required: Before deploying the indicator in real-time trading, conduct thorough backtesting across diverse assets and timeframes to understand its performance characteristics fully.
Asset-Specific Performance: The efficacy of the L3 Dark Horse Oscillator can differ significantly across various financial instruments and market conditions. Tailor your strategies accordingly.
NOTES
Historical Data: Ensure ample historical data availability to facilitate precise calculations and avoid inaccuracies stemming from insufficient data points.
Parameter Adjustments: Experiment with adjusting the default periods (27 and 36 bars) if you find them unsuitable for your specific trading style or market conditions.
Visual Customization: Modify the appearance settings, including line styles and gradient colors, to better suit personal preferences without compromising functionality.
Risk Management: While the indicator offers valuable insights, always adhere to robust risk management practices to safeguard against unexpected market fluctuations.
EXAMPLE STRATEGIES
Trend Following: Use the oscillator to confirm existing trends. When Component A crosses above Component B, consider entering long positions; conversely, look for short entries during downward crossovers.
Mean Reversion: Identify extreme readings near the upper (90) or lower (10) bands where prices might revert to mean levels, presenting potential reversal opportunities.
Divergence Analysis: Compare the oscillator's behavior with price action to spot divergences, which often precede trend reversals. Bullish divergence occurs when prices make lower lows but the oscillator shows higher lows, suggesting upward momentum.
RSI and CCICombined RSI and CCI Indicator for MetaTrader
The Combined RSI and CCI Indicator is a powerful hybrid momentum oscillator designed to merge the strengths of two popular indicators—the Relative Strength Index (RSI) and the Commodity Channel Index (CCI)—into a single, visually intuitive chart window. This tool enhances traders’ ability to identify overbought and oversold conditions, divergences, trend strength, and potential reversal zones with improved precision.
Purpose
By integrating RSI and CCI, this indicator helps filter out false signals that often occur when using each tool independently. It is especially useful for swing trading, trend confirmation, and spotting high-probability entry/exit zones. This dual-oscillator approach combines RSI’s relative momentum insights with CCI’s deviation-based analysis to produce a more reliable signal structure.
Key Features
Dual Oscillator Display: Plots both RSI and CCI on the same subwindow for easy comparison and correlation analysis.
Customizable Parameters:
RSI Period and Level (default: 14)
CCI Period and Typical Price Type (default: 20, TP)
Overbought/Oversold Levels for both indicators
Color-Coded Zones:
Background highlights when both RSI and CCI enter overbought/oversold territory, signaling high potential reversal zones.
Combined Signal Logic (Optional Feature):
Buy Signal: RSI < 30 and CCI < -100
Sell Signal: RSI > 70 and CCI > 100
These can be visualized as arrows or plotted as signal markers.
Trend Filter Overlay (Optional):
Can be combined with a moving average or price action filter to confirm trend direction before accepting signals.
Divergence Detection (Advanced Option):
Optional plotting of bullish or bearish divergence where both indicators diverge from price action.
Multi-Timeframe Compatibility:
Allows the use of higher timeframe RSI/CCI values to confirm signals on lower timeframes.
Benefits
Improved Signal Accuracy: Using both RSI and CCI together helps avoid false breakouts and whipsaws.
More Informed Decision-Making: Correlating momentum (RSI) with deviation (CCI) provides a well-rounded picture of market behavior.
Efficient Charting: Saves screen space and cognitive load by combining two indicators into one clean panel.
Scalable Strategy Integration: Can be used in discretionary trading or coded into automated strategies/alerts.
Use Case Example
In a ranging market, the indicator highlights zones where both RSI and CCI are oversold, alerting traders to potential bounce opportunities.
In trending markets, it confirms trend strength when RSI and CCI are both aligned with trend direction.
When RSI is diverging from price but CCI isn’t, it can be a clue of weakening momentum, helping traders scale out or avoid traps.
This combined indicator offers a versatile, high-performance toolset for traders looking to elevate their technical analysis by leveraging multiple momentum perspectives simultaneously.

Trend Strength MeterThe Trend Strength Meter (TSM) is a powerful and versatile indicator designed to help traders identify market trends, measure their strength, and detect potential reversals with ease. This indicator combines the power of moving averages, divergence detection, and a clean, customizable dashboard to provide actionable insights for traders of all levels.
How It Works
Trend Strength Calculation:
1. The TSM calculates the trend strength using the difference between two Exponential Moving Averages (EMAs): a fast EMA (default: 20) and a slow EMA (default: 50).
2. The difference is expressed as a percentage of the slow EMA, providing a clear measure of the trend's strength and direction.
Histogram Visualization:
1. A color-coded histogram visually represents the trend strength:
Green: Bullish trend
Red: Bearish trend
Gray: Neutral or no significant trend
2. A smoothed trend strength line (SMA of the trend strength) is also plotted for better clarity.
Divergence Detection:
1. The indicator detects bullish and bearish divergences using the RSI (Relative Strength Index) and price action.
2. Bullish Divergence: Price makes a lower low, but RSI makes a higher low, signaling potential upward momentum.
3. Bearish Divergence: Price makes a higher high, but RSI makes a lower high, signaling potential downward momentum.
=> Divergences are marked with arrows on the chart:
Green Arrow: Bullish divergence
Red Arrow: Bearish divergence
Dashboard:
1. A clean and informative dashboard displays key information:
Trend Strength Value: The current strength of the trend
Trend Direction: Bullish, Bearish, or Neutral
Last Signal: Buy, Sell, or None (based on divergence signals)
The dashboard is fully customizable and can be positioned anywhere on the chart (e.g., top-right, bottom-left, center, etc.).
Key Features
1. Trend Strength Measurement: Quickly identify the strength and direction of the trend.
2. Divergence Detection: Spot potential reversals before they occur with bullish and bearish divergence signals.
3. Customizable Dashboard: Move the dashboard to your preferred location on the chart for better visibility.
4. User-Friendly Design: Clean visuals and intuitive color coding make it easy to interpret market conditions.
5. Actionable Signals: Provides clear Buy/Sell signals based on divergence, helping traders make informed decisions.
How to Use
1. Trend Confirmation:
Use the histogram and trend strength value to confirm the current market trend.
Green bars indicate a bullish trend, while red bars indicate a bearish trend.
2. Divergence Signals:
Look for divergence arrows (green for bullish, red for bearish) to anticipate potential reversals.
Combine divergence signals with other technical analysis tools for higher accuracy.
3. Dashboard Insights:
Monitor the dashboard for real-time updates on trend strength, direction, and the latest signal.
Use the "Last Signal" (Buy/Sell) to validate your trading decisions.
4. Custom Settings:
Adjust the EMA lengths and divergence lookback period to suit your trading style and timeframe.
Position the dashboard anywhere on the chart for convenience.
Best Practices
1. Use the TSM in conjunction with other indicators or price action analysis for confirmation.
2. Test the indicator on different timeframes to find the one that works best for your strategy.
3. Always practice proper risk management when trading.
Disclaimer
This indicator is a tool to assist in technical analysis and should not be used as a standalone trading strategy. Past performance is not indicative of future results. Always conduct your own research and consult with a financial advisor before making trading decisions.

alphaJohnny Dynamic RSI IndicatorAlphaJohnny Dynamic RSI Indicator (Dyn RSI)
The Dynamic RSI Indicator (Dyn RSI) is a custom Pine Script tool designed for TradingView that aggregates Relative Strength Index (RSI) signals from multiple timeframes to provide a comprehensive view of market momentum. It combines RSI data from Weekly, Daily, 4-hour, 1-hour, and 30-minute intervals, offering traders a flexible and customizable way to analyze trends across different periods.
Key Features:
Multi-Timeframe RSI Aggregation: Combines RSI signals from user-selected timeframes for a holistic momentum assessment.
Dynamic or Equal Weighting: Choose between correlation-based dynamic weights (adjusting based on each timeframe’s correlation with price changes) or equal weights for simplicity.
Smoothed Momentum Line: A visually intuitive line that reflects the strength of the aggregate signal, smoothed for clarity.
Color-Coded Signal Strength:
Dark Green: Strong buy signal
Light Green: Weak buy signal
Yellow: Neutral
Light Red: Weak sell signal
Dark Red: Strong sell signal
Visual Markers: Large green triangles at the bottom for strong buy signals and red triangles at the top for strong sell signals.
How to Use:
Apply to Chart: Add the indicator to your TradingView chart (it will appear in a separate pane).
Customize Settings: Adjust inputs like RSI period, signal thresholds, included timeframes, weighting method, and smoothing period to fit your trading style.
Interpret Signals:
Momentum Line: Watch for color changes to gauge market conditions.
Triangles: Green at the bottom for strong buy opportunities, red at the top for strong sell opportunities.
Notes:
The indicator is designed for a separate pane (overlay=false), with triangles positioned relative to the pane’s range.
Fine-tune thresholds and weights based on your strategy and the asset being analyzed.
The source code is open for modification to suit your needs.
This indicator is ideal for traders seeking a multi-timeframe perspective on RSI to identify potential trend reversals and momentum shifts.

Dynamic Currency Strength IndexDescription:
This indicator calculates the relative strength of the base currency and quote currency of the currently selected forex pair. Instead of just using a single pair comparison (e.g., GBPUSD - AUDUSD), it determines currency strength using a basket of related pairs, making it more accurate and useful for trading decisions.
How It Works:
Extracts the base and quote currencies from the selected forex pair.
Calculates their individual strengths using multiple related forex pairs.
Displays the strength difference between the base and quote currencies.
How to Use:
✔️ If the strength difference is positive, the base currency is stronger → Bullish signal.
✔️ If the strength difference is negative, the quote currency is stronger → Bearish signal.
✔️ Use it to confirm trends, filter trades, and improve entry timing in forex trading.
💡 Ideal for traders using trend-based strategies (Dow Theory, HH-HL patterns, breakouts, etc.).

Bollinger Bands + RSI [Uncle Sam Trading]The Bollinger Bands + RSI indicator combines two popular technical analysis tools, Bollinger Bands (BB) and the Relative Strength Index (RSI), into a unified framework designed to assess both market volatility and momentum. This indicator provides both visual signals on the chart, and allows you to set alerts. It is intended to help traders identify potential overbought/oversold conditions, trend reversals, and to refine trade entry and exit points.
Key Features:
Bollinger Bands: The indicator plots Bollinger Bands, which consist of a basis line (typically a 20-period Simple Moving Average), an upper band (basis + 2 standard deviations), and a lower band (basis - 2 standard deviations). The bands dynamically adjust to market volatility, widening during periods of increased volatility and contracting during periods of decreased volatility.
Relative Strength Index (RSI): The RSI, a momentum oscillator, is plotted in a separate pane below the price chart. It measures the magnitude of recent price changes to evaluate overbought or oversold conditions in the price of a stock or other asset. Traditional interpretation uses 70 and 30 as overbought and oversold levels, respectively.
Overbought/Oversold Zones Highlighting: This indicator uniquely highlights overbought and oversold zones directly on the price chart based on the RSI values. When the RSI is above the overbought level (default 70), a red-shaded area is displayed. When the RSI is below the oversold level (default 30), a green-shaded area is displayed. These visual cues enhance the identification of potential trend reversals.
Buy and Sell Signals: The indicator generates buy signals when the price crosses above the lower Bollinger Band and the RSI is below the oversold level (if the RSI filter is enabled). Sell signals are generated when the price crosses below the upper Bollinger Band and the RSI is above the overbought level (if the RSI filter is enabled). These signals are plotted as green upward-pointing triangles (buy) and red downward-pointing triangles (sell) on the chart.
Customizable Parameters: Users can adjust various settings, including:
Bollinger Bands Length: The number of periods used to calculate the moving average and standard deviation.
Bollinger Bands Standard Deviation: The multiplier used to determine the distance of the upper and lower bands from the basis.
RSI Length: The number of periods used to calculate the RSI.
RSI Overbought/Oversold Levels: The threshold values that define overbought and oversold conditions for the RSI.
Use RSI Filter for Signals: Enable/disable the RSI filter for buy and sell signals.
Colors: The colors of the Bollinger Bands, RSI, overbought/oversold levels, and zone highlights can be customized to suit user preferences.
Alerts: The indicator supports customizable alerts for various conditions, including:
Buy Signal: Triggered when a buy signal is generated.
Sell Signal: Triggered when a sell signal is generated.
Price Crossed Upper BB: Triggered when the price crosses above the upper Bollinger Band.
Price Crossed Lower BB: Triggered when the price crosses below the lower Bollinger Band.
RSI Overbought: Triggered when the RSI crosses above the overbought level.
RSI Oversold: Triggered when the RSI crosses below the oversold level.
How to Use:
The Bollinger Bands + RSI indicator can be used in various ways, including:
Identifying Potential Trend Reversals: Price crosses above the lower band coupled with an oversold RSI (and highlighted zone) may signal a bullish reversal. Conversely, a price cross below the upper band with an overbought RSI (and highlighted zone) may indicate a bearish reversal.
Confirming Trend Strength: In an uptrend, the price may "ride" the upper band, while in a downtrend, it may "ride" the lower band.
Exit Signals: Crossing the opposite band while in a trade, particularly with confirming RSI signals, is often used to identify potential exit points.
Combined with Other Analysis: This indicator works well in conjunction with other technical analysis tools, such as trend lines, support/resistance levels, chart patterns, and moving average-based strategies.
Disclaimer:
This indicator is for educational and informational purposes only and should not be considered as financial advice. Trading involves risk, and past performance is not indicative of future results. Always conduct thorough research and consider your risk tolerance before making any trading decisions.

Custom RSI & MACD Momentum Entry SignalsIndicator Explanation: Custom RSI & MACD Momentum Entry Signals
Introduction
The "Custom RSI & MACD Momentum Entry Signals" indicator combines the Relative Strength Index (RSI) and the Moving Average Convergence Divergence (MACD) to generate precise long and short entry signals. This indicator offers a powerful combination of overbought/oversold zones, momentum analysis, and RSI-EMA crossovers to assist traders in making better decisions.
How the Indicator Works
1. RSI Calculation and EMA
The RSI is calculated based on the closing price with an adjustable period (default: 14).
An Exponential Moving Average (EMA) of the RSI (default: 9) is plotted to identify RSI trend changes.
When the RSI crosses its EMA upwards, it signals a bullish impulse. Conversely, a downward cross indicates a bearish impulse.
2. MACD Calculation and Momentum Shifts
The MACD line is derived from the difference between a fast EMA (default: 12) and a slow EMA (default: 26).
The Signal line is the EMA of the MACD line (default: 9).
The MACD histogram represents the difference between the MACD line and the Signal line.
Momentum shifts are detected as follows:
Weakening Bearish: Histogram is negative but increasing (less bearish pressure).
Strengthening Bullish: Histogram is positive and rising.
Weakening Bullish: Histogram is positive but decreasing.
Strengthening Bearish: Histogram is negative and falling.
Signal Generation
Long Signals
A Long signal is triggered when all of the following conditions are met:
The RSI was previously below 30 (oversold condition).
MACD momentum shifts from "strengthening bearish" to "weakening bearish" or turns bullish.
The RSI crosses its EMA upwards.
A green upward arrow is displayed below the bar, and the background is lightly shaded green for additional visualization.
Short Signals
A Short signal is triggered when all of the following conditions are met:
The RSI was previously above 70 (overbought condition).
MACD momentum shifts from "strengthening bullish" to "weakening bullish" or turns bearish.
The RSI crosses its EMA downwards.
A red downward arrow is displayed above the bar, and the background is lightly shaded red for additional visualization.
Visual Elements
RSI and EMA:
The RSI is shown in purple.
The RSI EMA is shown in blue.
Horizontal lines at 30 (oversold) and 70 (overbought) provide additional context.
MACD:
The MACD line is displayed in blue.
The Signal line is displayed in orange.
The zero line is added for easier interpretation.
Signals:
Green arrows: Long signals.
Red arrows: Short signals.
Background color: Light green for long conditions, light red for short conditions.
Use Cases
This indicator is ideal for:
Trend Followers: Combining RSI and MACD allows traders to identify entry points during impulsive trend shifts.
Swing Traders: Long and short signals can be used at reversal points to capture short-term price movements.
Momentum Traders: By considering MACD momentum, the indicator provides additional confidence in signal generation.
Customizable Settings
The indicator provides flexible input options:
RSI Period (default: 14)
RSI EMA Period (default: 9)
MACD Parameters: Fast, slow, and signal EMAs can be adjusted.
Conclusion
The Custom RSI & MACD Momentum Entry Signals indicator is a powerful tool for traders looking to combine RSI and MACD to identify high-probability entry signals. With clear visualization and precise signal generation, traders can make decisions more efficiently and capitalize on market movements.

XAUUSD Multi-Timeframe Trend AnalyzerOverview
The "XAUUSD Multi-Timeframe Trend Analyzer" is an advanced script designed to provide a comprehensive analysis of the XAUUSD (Gold/US Dollar) trend across multiple timeframes simultaneously. By combining several key technical indicators, this tool helps traders quickly assess the market direction and trend strength for M15, M30, H1, H4, and D1 timeframes.
Multi-Timeframe Analysis: Displays the trend direction and strength across M15, M30, H1, H4, and D1 timeframes, allowing for a complete overview in a single glance.
Comprehensive Indicator Blend: Utilizes six popular technical indicators to determine the trend—Moving Averages, RSI, MACD, Bollinger Bands, DMI, and Parabolic SAR.
Trend Strength Scoring: Provides a numerical trend strength score (from -6 to 6) based on the alignment of the indicators, with positive values indicating uptrends and negative values for downtrends.
Visual Table Display: Displays results in a color-coded table (green for uptrend, red for downtrend, yellow for neutral) with a strength score for each timeframe, helping traders quickly assess market conditions.
How It Works
This script calculates the overall trend and its strength for each selected timeframe by analyzing six widely-used technical indicators:
Moving Averages (MA): The script uses a Fast and a Slow Moving Average. When the Fast MA crosses above the Slow MA, it indicates an uptrend. When the Fast MA crosses below, it signals a downtrend.
Relative Strength Index (RSI): The RSI is used to assess momentum. An RSI value above 50 suggests bullish momentum, while a value below 50 suggests bearish momentum.
Moving Average Convergence Divergence (MACD): MACD measures momentum and trend direction. When the MACD line crosses above the signal line, it signals bullish momentum; when it crosses below, it signals bearish momentum.
Bollinger Bands: These measure price volatility. When the price is above the middle Bollinger Band, the script considers the trend to be bullish, and when it's below, bearish.
Directional Movement Index (DMI): The DMI compares positive directional movement (DI+) and negative directional movement (DI-). A stronger DI+ over DI- signals an uptrend and vice versa.
Parabolic SAR: This indicator is used for determining potential trend reversals and setting stop-loss levels. If the price is above the Parabolic SAR, it indicates an uptrend, and if below, a downtrend.
Trend Strength Calculation
The script calculates a trend strength score for each timeframe:
Each indicator adds or subtracts 1 to the score based on whether it aligns with an uptrend or a downtrend.
A score of 6 indicates a Strong Uptrend, with all indicators aligned bullishly.
A score of -6 indicates a Strong Downtrend, with all indicators aligned bearishly.
Intermediate scores (e.g., 2 or -2) indicate Weak Uptrend or Weak Downtrend, suggesting that not all indicators are in agreement.
A score between 1 and -1 indicates a Neutral trend, suggesting uncertainty in the market.
How to Use
Assess Trend Direction and Strength: The table provides an easy-to-read summary of the trend and its strength on different timeframes. Look for timeframes where the strength is high (either 6 for a strong uptrend or -6 for a strong downtrend) to confirm the market’s overall direction.
Use in Conjunction with Other Strategies: This indicator is designed to provide a comprehensive view of the market. Traders should combine it with other strategies, such as price action analysis or candlestick patterns, to further confirm their trades.
Trend Reversal or Continuation: A weak trend (e.g., a strength of 2 or -2) could signal a possible reversal or a trend that has lost momentum. Strong trends (with a strength of 6 or -6) indicate higher confidence in trend continuation.
Multiple Timeframe Confirmation: Look for alignment across multiple timeframes to confirm the strength and direction of the trend before entering trades. For example, if M15, M30, and H1 are all showing a strong uptrend, it suggests a higher probability of the trend continuing.
Customization Options
- Adjustable Indicators: Users can modify the length and parameters of the Moving Averages, RSI, MACD, Bollinger Bands, DMI, and Parabolic SAR to suit their trading style.
- Flexible Timeframes: You can toggle between different timeframes (M15, M30, H1, H4, D1) to focus on the intervals most relevant to your strategy.
Ideal For
- Traders looking for a detailed, multi-timeframe trend analysis tool for XAUUSD.
- Traders who rely on trend-following strategies and need confirmation across multiple timeframes.
- Those who prefer a multi-indicator approach to avoid false signals and improve the accuracy of their trades.
Disclaimer
This indicator is for informational and educational purposes only. It is recommended to combine this with proper risk management strategies and your own analysis. Past performance does not guarantee future results. Always perform your own due diligence before making trading decisions.

TASC 2024.11 Ultimate Strength Index█ OVERVIEW
This script implements the Ultimate Strength Index (USI) indicator, introduced by John Ehlers in his article titled "Ultimate Strength Index (USI)" from the November 2024 edition of TASC's Traders' Tips . The USI is a modified version of Wilder's original Relative Strength Index (RSI) that incorporates Ehlers' UltimateSmoother lowpass filter to produce an output with significantly reduced lag.
█ CONCEPTS
Many technical indicators, including the RSI, lag due to their heavy reliance on historical data. John Ehlers reformulated the RSI to substantially reduce lag by applying his UltimateSmoother filter to upward movements ( strength up - SU ) and downward movements ( strength down - SD ) in the time series, replacing the standard process of smoothing changes with rolling moving averages (RMAs). Ehlers' recent works, covered in our recent script publications, have shown that the UltimateSmoother is an effective alternative to other classic averages, offering notably less lag in its response.
Ehlers also modified the RSI formula to produce an index that ranges from -1 to +1 instead of 0 to 100. As a result, the USI indicates bullish conditions when its value moves above 0 and bearish conditions when it falls below 0.
The USI retains many of the strengths of the traditional RSI while offering the advantage of reduced lag. It generally uses a larger lookback window than the conventional RSI to achieve similar behavior, making it suitable for trend trading with longer data lengths. When applied with shorter lengths, the USI's peaks and valleys tend to align closely with significant turning points in the time series, making it a potentially helpful tool for timing swing trades.
█ CALCULATIONS
The first step in the USI's calculation is determining each bar's strength up (SU) and strength down (SD) values. If the current bar's close exceeds the previous bar's, the calculation assigns the difference to SU. Otherwise, SU is zero. Likewise, if the current bar's close is below the previous bar's, it assigns the difference to SD. Otherwise, SD is zero.
Next, instead of the RSI's typical smoothing process, the USI's calculation applies the UltimateSmoother to the short-term average SU and SD values, reducing high-frequency chop in the series with low lag.
Finally, this formula determines the USI value:
USI = ( Ult (SU) − Ult (SD)) / ( Ult (SU) + Ult (SD)),
where Ult (SU) and Ult (SD) are the smoothed average strength up and strength down values.
Post-Open Long Strategy with ATR-based Stop Loss and Take ProfitThe "Post-Open Long Strategy with ATR-Based Stop Loss and Take Profit" is designed to identify buying opportunities after the German and US markets open. It combines various technical indicators to filter entry signals, focusing on breakout moments following price lateralization periods.
Key Components and Their Interaction:
Bollinger Bands (BB):
Description: Uses BB with a 14-period length and standard deviation multiplier of 1.5, creating narrower bands for lower timeframes.
Role in the Strategy: Identifies low volatility phases (lateralization). The lateralization condition is met when the price is near the simple moving average of the BB, suggesting an imminent increase in volatility.
Exponential Moving Averages (EMA):
10-period EMA: Quickly detects short-term trend direction.
200-period EMA: Filters long-term trends, ensuring entries occur in a bullish market.
Interaction: Positions are entered only if the price is above both EMAs, indicating a consolidated positive trend.
Relative Strength Index (RSI):
Description: 7-period RSI with a threshold above 30.
Role in the Strategy: Confirms the market is not oversold, supporting the validity of the buy signal.
Average Directional Index (ADX):
Description: 7-period ADX with 7-period smoothing and a threshold above 10.
Role in the Strategy: Assesses trend strength. An ADX above 10 indicates sufficient momentum to justify entry.
Average True Range (ATR) for Dynamic Stop Loss and Take Profit:
Description: 14-period ATR with multipliers of 2.0 for Stop Loss and 4.0 for Take Profit.
Role in the Strategy: Adjusts exit levels based on current volatility, enhancing risk management.
Resistance Identification and Breakout:
Description: Analyzes the highs of the last 20 candles to identify resistance levels with at least two touches.
Role in the Strategy: A breakout above this level signals a potential continuation of the bullish trend.
Time Filters and Market Conditions:
Trading Hours: Operates only during the opening of the German market (8:00 - 12:00) and US market (15:30 - 19:00).
Panic Candle: The current candle must close negative, leveraging potential emotional reactions in the market.
Avoiding Entry During Pullbacks:
Description: Checks that the two previous candles are not both bearish.
Role in the Strategy: Avoids entering during a potential pullback, improving trade success probability.
Post-Open Long Strategy with ATR-Based Stop Loss and Take Profit
The "Post-Open Long Strategy with ATR-Based Stop Loss and Take Profit" is designed to identify buying opportunities after the German and US markets open. It combines various technical indicators to filter entry signals, focusing on breakout moments following price lateralization periods.
Key Components and Their Interaction:
Bollinger Bands (BB):
Description: Uses BB with a 14-period length and standard deviation multiplier of 1.5, creating narrower bands for lower timeframes.
Role in the Strategy: Identifies low volatility phases (lateralization). The lateralization condition is met when the price is near the simple moving average of the BB, suggesting an imminent increase in volatility.
Exponential Moving Averages (EMA):
10-period EMA: Quickly detects short-term trend direction.
200-period EMA: Filters long-term trends, ensuring entries occur in a bullish market.
Interaction: Positions are entered only if the price is above both EMAs, indicating a consolidated positive trend.
Relative Strength Index (RSI):
Description: 7-period RSI with a threshold above 30.
Role in the Strategy: Confirms the market is not oversold, supporting the validity of the buy signal.
Average Directional Index (ADX):
Description: 7-period ADX with 7-period smoothing and a threshold above 10.
Role in the Strategy: Assesses trend strength. An ADX above 10 indicates sufficient momentum to justify entry.
Average True Range (ATR) for Dynamic Stop Loss and Take Profit:
Description: 14-period ATR with multipliers of 2.0 for Stop Loss and 4.0 for Take Profit.
Role in the Strategy: Adjusts exit levels based on current volatility, enhancing risk management.
Resistance Identification and Breakout:
Description: Analyzes the highs of the last 20 candles to identify resistance levels with at least two touches.
Role in the Strategy: A breakout above this level signals a potential continuation of the bullish trend.
Time Filters and Market Conditions:
Trading Hours: Operates only during the opening of the German market (8:00 - 12:00) and US market (15:30 - 19:00).
Panic Candle: The current candle must close negative, leveraging potential emotional reactions in the market.
Avoiding Entry During Pullbacks:
Description: Checks that the two previous candles are not both bearish.
Role in the Strategy: Avoids entering during a potential pullback, improving trade success probability.
Entry and Exit Conditions:
Long Entry:
The price breaks above the identified resistance.
The market is in a lateralization phase with low volatility.
The price is above the 10 and 200-period EMAs.
RSI is above 30, and ADX is above 10.
No short-term downtrend is detected.
The last two candles are not both bearish.
The current candle is a "panic candle" (negative close).
Order Execution: The order is executed at the close of the candle that meets all conditions.
Exit from Position:
Dynamic Stop Loss: Set at 2 times the ATR below the entry price.
Dynamic Take Profit: Set at 4 times the ATR above the entry price.
The position is automatically closed upon reaching the Stop Loss or Take Profit.
How to Use the Strategy:
Application on Volatile Instruments:
Ideal for financial instruments that show significant volatility during the target market opening hours, such as indices or major forex pairs.
Recommended Timeframes:
Intraday timeframes, such as 5 or 15 minutes, to capture significant post-open moves.
Parameter Customization:
The default parameters are optimized but can be adjusted based on individual preferences and the instrument analyzed.
Backtesting and Optimization:
Backtesting is recommended to evaluate performance and make adjustments if necessary.
Risk Management:
Ensure position sizing respects risk management rules, avoiding risking more than 1-2% of capital per trade.
Originality and Benefits of the Strategy:
Unique Combination of Indicators: Integrates various technical metrics to filter signals, reducing false positives.
Volatility Adaptability: The use of ATR for Stop Loss and Take Profit allows the strategy to adapt to real-time market conditions.
Focus on Post-Lateralization Breakout: Aims to capitalize on significant moves following consolidation periods, often associated with strong directional trends.
Important Notes:
Commissions and Slippage: Include commissions and slippage in settings for more realistic simulations.
Capital Size: Use a realistic trading capital for the average user.
Number of Trades: Ensure backtesting covers a sufficient number of trades to validate the strategy (ideally more than 100 trades).
Warning: Past results do not guarantee future performance. The strategy should be used as part of a comprehensive trading approach.
With this strategy, traders can identify and exploit specific market opportunities supported by a robust set of technical indicators and filters, potentially enhancing their trading decisions during key times of the day.

RSI 15/60 and ADX PlotIn this script, the buy and sell criteria are based on the Relative Strength Index (RSI) values calculated for two different timeframes: the 15-minute RSI and the hourly RSI. These timeframes are used together to check signals when certain thresholds are crossed, providing confirmation across both short-term and longer-term momentum.
Buy Criteria:
Condition 1:
Hourly RSI > 60: This means the longer-term momentum shows strength.
15-minute RSI crosses above 60: This shows that the shorter-term momentum is catching up and confirms increasing strength.
Condition 2:
15-minute RSI > 60: This indicates that the short-term trend is already strong.
Hourly RSI crosses above 60: This confirms that the longer-term trend is also gaining strength.
Both conditions aim to capture the moments when the market shows increasing strength across both short and long timeframes, signaling a potential buy opportunity.
Sell Criteria:
Condition 1:
Hourly RSI < 40: This indicates that the longer-term trend is weakening.
15-minute RSI crosses below 40: The short-term momentum is also turning down, confirming the weakening trend.
Condition 2:
15-minute RSI < 40: The short-term trend is already weak.
Hourly RSI crosses below 40: The longer-term trend is now confirming the weakness, indicating a potential sell.
These conditions work to identify when the market is showing weakness in both short-term and long-term timeframes, signaling a potential sell opportunity.
ADX Confirmation :
The Average Directional Index (ADX) is a key tool for measuring the strength of a trend. It can be used alongside the RSI to confirm whether a buy or sell signal is occurring in a strong trend or during market consolidation. Here's how ADX can be integrated:
ADX > 25: This indicates a strong trend. Using this threshold, you can confirm buy or sell signals when there is a strong upward or downward movement in the market.
Buy Example: If a buy signal (RSI > 60) is triggered and the ADX is above 25, this confirms that the market is in a strong uptrend, making the buy signal more reliable.
Sell Example: If a sell signal (RSI < 40) is triggered and the ADX is above 25, it confirms a strong downtrend, validating the sell signal.
ADX < 25: This suggests a weak or non-existent trend. In this case, RSI signals might be less reliable since the market could be moving sideways.
Final Approach:
The RSI criteria help identify potential overbought and oversold conditions in both short and long timeframes.
The ADX confirmation ensures that the signals generated are happening during strong trends, increasing the likelihood of successful trades by filtering out weak or choppy market conditions.
This combination of RSI and ADX can help traders make more informed decisions by ensuring both momentum and trend strength align before entering or exiting trades.

Supertrend with Extreme SignalsOriginality and Usefulness
The "Supertrend with Extreme Signals" indicator is an innovative tool I've developed to combine the strengths of the Supertrend indicator with the RSI (Relative Strength Index). This combination enhances the accuracy of entry and exit signals, making it more useful for traders looking to gain a comprehensive understanding of market conditions.
Justification for Mashup:
Supertrend: This is a trend-following indicator that identifies the current market trend and potential reversal points by adjusting dynamically based on market volatility.
RSI: A momentum oscillator that measures the speed and change of price movements. It helps pinpoint overbought and oversold conditions, adding an extra layer of confirmation to trend signals.
By merging these two indicators, the script filters out false signals and improves the precision of trade entries and exits. The Supertrend identifies the trend direction, while the RSI confirms the strength and potential reversals within that trend.
Description
Overview
The "Supertrend with Extreme Signals" indicator is a powerful hybrid tool that brings together the trend-following capability of the Supertrend and the momentum analysis of RSI. This integration provides clear buy and sell signals, helping traders make more informed decisions.
What It Does
Trend Identification: Utilizes the Supertrend to determine the prevailing market trend.
Signal Confirmation: Uses RSI to confirm signals by identifying overbought and oversold conditions.
Buy and Sell Signals: Generates buy signals when the price crosses above the Supertrend line and RSI indicates oversold conditions. Generates sell signals when the price crosses below the Supertrend line and RSI indicates overbought conditions.
How It Works
Supertrend Calculation:
Calculates the Average True Range (ATR) to assess market volatility.
Computes upper and lower levels based on the mid-price and ATR.
Determines trend direction by smoothing these levels over a specified period.
Dynamically adjusts the Supertrend value based on market conditions.
RSI Calculation:
Calculates the RSI over a defined period to measure price momentum.
Uses RSI levels to identify overbought (above 70) and oversold (below 30) conditions.
Signal Generation:
Buy Signal: Triggered when the price crosses above the Supertrend line and RSI is below the oversold threshold.
Sell Signal: Triggered when the price crosses below the Supertrend line and RSI is above the overbought threshold.
How to Use It
Trend Following: Use the Supertrend color to identify the current trend (green for uptrend, red for downtrend).
Entry Signals: Look for buy signals (green label) when the price crosses above the Supertrend line and RSI is in the oversold zone.
Exit Signals: Look for sell signals (red label) when the price crosses below the Supertrend line and RSI is in the overbought zone.
Visual Confirmation: The background color changes based on the trend direction, providing a quick visual cue for the current market state.
This script is especially useful for traders who combine trend-following strategies with momentum indicators. It helps filter out false signals and provides a robust framework for identifying profitable trading opportunities.
Concepts Underlying Calculations
ATR (Average True Range): Measures market volatility by calculating the average range of price movements over a specified period.
Supertrend: A trend-following indicator that adjusts dynamically based on market volatility.
RSI (Relative Strength Index): A momentum oscillator that measures the speed and change of price movements, helping to identify overbought and oversold conditions.
By combining these concepts, the "Supertrend with Extreme Signals" indicator offers a balanced approach to trading. It considers both trend direction and market momentum, making it a powerful tool for improving trading performance through informed market analysis.

Trend Strength | Flux Charts💎 GENERAL OVERVIEW
Introducing the new Trend Strength indicator! Latest trends and their strengths play an important role for traders. This indicator aims to make trend and strength detection much easier by coloring candlesticks based on the current strength of trend. More info about the process in the "How Does It Work" section.
Features of the new Trend Strength Indicator :
3 Trend Detection Algorithms Combined (RSI, Supertrend & EMA Cross)
Fully Customizable Algorithm
Strength Labels
Customizable Colors For Bullish, Neutral & Bearish Trends
📌 HOW DOES IT WORK ?
This indicator uses three different methods of trend detection and combines them all into one value. First, the RSI is calculated. The RSI outputs a value between 0 & 100, which this indicator maps into -100 <-> 100. Let this value be named RSI. Then, the Supertrend is calculated. Let SPR be -1 if the calculated Supertrend is bearish, and 1 if it's bullish. After that, latest EMA Cross is calculated. This is done by checking the distance between the two EMA's adjusted by the user. Let EMADiff = EMA1 - EMA2. Then EMADiff is mapped from -ATR * 2 <-> ATR * 2 to -100 <-> 100.
Then a Total Strength (TS) is calculated by given formula : RSI * 0.5 + SPR * 0.2 + EMADiff * 0.3
The TS value is between -100 <-> 100, -100 being fully bearish, 0 being true neutral and 100 being fully bullish.
Then the Total Strength is converted into a color adjusted by the user. The candlesticks in the chart will be presented with the calculated color.
If the Labels setting is enabled, each time the trend changes direction a label will appear indicating the new direction. The latest candlestick will always show the current trend with a label.
EMA = Exponential Moving Average
RSI = Relative Strength Index
ATR = Average True Range
🚩 UNIQUENESS
The main point that differentiates this indicator from others is it's simplicity and customization options. The indicator interprets trend and strength detection in it's own way, combining 3 different well-known trend detection methods: RSI, Supertrend & EMA Cross into one simple method. The algorithm is fully customizable and all styling options are adjustable for the user's liking.
⚙️ SETTINGS
1. General Configuration
Detection Length -> This setting determines the amount of candlesticks the indicator will look for trend detection. Higher settings may help the indicator find longer trends, while lower settings will help with finding smaller trends.
Smoothing -> Higher settings will result in longer periods of time required for trend to change direction from bullish to bearish and vice versa.
EMA Lengths -> You can enter two EMA Lengths here, the second one must be longer than the first one. When the shorter one crosses under the longer one, this will be a bearish sign, and if it crosses above it will be a bullish sign for the indicator.
Labels -> Enables / Disables trend strength labels.

Adaptive Bollinger-RSI Trend Signal [CHE]Adaptive Bollinger-RSI Trend Signal
Indicator Overview:
The "Adaptive Bollinger-RSI Trend Signal " (ABRT Signal ) is a sophisticated trading tool designed to provide clear and actionable buy and sell signals by combining the power of Bollinger Bands and the Relative Strength Index (RSI). This indicator aims to help traders identify potential trend reversals and confirm entry and exit points with greater accuracy.
Key Features:
1. Bollinger Bands Integration:
- Utilizes Bollinger Bands to detect price volatility and identify overbought or oversold conditions.
- Configurable parameters: Length, Source, and Multiplier for precise adjustments based on trading preferences.
- Color customization: Change the colors of the basis line, upper band, lower band, and the fill color between bands.
2. RSI Integration:
- Incorporates the Relative Strength Index (RSI) to validate potential buy and sell signals.
- Configurable parameters: Length, Source, Upper Threshold, and Lower Threshold for customized signal generation.
3. Signal Generation:
- Buy Signal: Generated when the price crosses below the lower Bollinger Band and the RSI crosses above the lower threshold, indicating a potential upward trend.
- Sell Signal: Generated when the price crosses above the upper Bollinger Band and the RSI crosses below the upper threshold, indicating a potential downward trend.
- Color customization: Change the colors of the buy and sell signal labels.
4. State Tracking:
- Tracks and records crossover and crossunder states of the price and RSI to ensure signals are only generated under the right conditions.
- Monitors the basis trend (SMA of the Bollinger Bands) to provide context for signal validation.
5. Counters and Labels:
- Labels each buy and sell signal with a counter to indicate the number of consecutive signals.
- Counters reset upon the generation of an opposite signal, ensuring clarity and preventing signal clutter.
6. DCA (Dollar-Cost Averaging) Calculation:
- Stores the close price at each signal and calculates the average entry price (DCA) for both buy and sell signals.
- Displays the number of positions and DCA values in a label on the chart.
7. Customizable Inputs:
- Easily adjustable parameters for Bollinger Bands, RSI, and colors to suit various trading strategies and timeframes.
- Boolean input to show or hide the table label displaying position counts and DCA values.
- Intuitive and user-friendly configuration options for traders of all experience levels.
How to Use:
1. Setup:
- Add the "Adaptive Bollinger-RSI Trend Signal " to your TradingView chart.
- Customize the input parameters to match your trading style and preferred timeframe.
- Adjust the colors of the indicator elements to your preference for better visibility and clarity.
2. Interpreting Signals:
- Buy Signal: Look for a "Buy" label on the chart, indicating a potential entry point when the price is oversold and RSI signals upward momentum.
- Sell Signal: Look for a "Sell" label on the chart, indicating a potential exit point when the price is overbought and RSI signals downward momentum.
3. Trade Execution:
- Use the buy and sell signals to guide your trade entries and exits, aligning them with your overall trading strategy.
- Monitor the counter labels to understand the strength and frequency of signals, helping you make informed decisions.
4. Adjust and Optimize:
- Regularly review and adjust the indicator parameters based on market conditions and backtesting results.
- Combine this indicator with other technical analysis tools to enhance your trading accuracy and performance.
5. Monitor DCA Values:
- Enable the table label to display the number of positions and average entry prices (DCA) for both buy and sell signals.
- Use this information to assess the cost basis of your trades and make strategic adjustments as needed.
Conclusion:
The Adaptive Bollinger-RSI Trend Signal is a powerful and versatile trading tool designed to help traders identify and capitalize on trend reversals with confidence. By combining the strengths of Bollinger Bands and RSI, this indicator provides clear and reliable signals, making it an essential addition to any trader's toolkit. Customize the settings, interpret the signals, and execute your trades with precision using this comprehensive indicator.

Yeong RRGThe code outlines a trading strategy that leverages Relative Strength (RS) and Rate of Change (RoC) to make trading decisions. Here's a detailed breakdown of the tactic described by the code:
Ticker and Period Selection: The strategy begins by selecting a stock ticker symbol and defining a period (len) for the calculations, which defaults to 14 but can be adjusted by the user.
Stock and Index Data Retrieval: It fetches the closing price (stock_close) of the chosen stock and calculates its 25-period exponential moving average (stock_ema). Additionally, it retrieves the closing price of the S&P 500 Index (index_close), used as a benchmark for calculating Relative Strength.
Relative Strength Calculation: The Relative Strength (rs) is computed by dividing the stock's closing price by the index's closing price, then multiplying by 100 to scale the result. This metric is used to assess the stock's performance relative to the broader market.
Moving RS Ratio and Rate of Change: The strategy calculates a Simple Moving Average (sma) of the RS over the specified period to get the RS Ratio (rs_ratio). It then computes the Rate of Change (roc) of this RS Ratio over the same period to get the RM Ratio (rm_ratio).
Normalization: The RS Ratio and RM Ratio are normalized using a formula that adjusts their values based on the mean and standard deviation of their respective series over the specified window. This normalization process helps in standardizing the indicators, making them easier to interpret and compare.
Indicator Plotting: The normalized RS Ratio (jdk_rs_ratio) and RM Ratio (jdk_rm_ratio) are plotted on the chart with different colors for visual analysis. A horizontal line (hline) at 100 serves as a reference point, indicating a neutral level for the indicators.
State Color Logic: The script includes a logic to determine the state color (statecolor) based on the previous state color and the current values of jdk_rs_ratio and jdk_rm_ratio. This color coding is intended to visually represent different market states: green for bullish, red for bearish, yellow for hold, and blue for watch conditions.
Signal Generation: The strategy generates buy, sell, hold, and watch signals based on the state color and the indicators' values relative to 100. For example, a buy signal is generated when both jdk_rs_ratio and jdk_rm_ratio are above 100, and the background color is set to green to reflect this bullish condition.
Trade Execution: Finally, the strategy executes trades based on the generated signals. A "BUY" trade is entered when a buy signal is present, and it is closed when a sell signal occurs.
Overall, the strategy uses a combination of RS and RoC indicators, normalized for better comparison, to identify potential buy and sell opportunities based on the stock's performance relative to the market and its momentum.

Trading Zones based on RS / Volume / PullbackThis is an Indicator which identifies different Trading Zones on the chart.
This should be Primarily used for Long Trades.
Trading Zones: and the Reasoning behind them
Long Zone -> One can do a Potential Entry (Buy) when this Zone is identified, but one could also wait for 'Entry Zone' (explained next) for a better Risk/Reward Trade.
Long Zones are identified with the help of Relative Strength and by an Intermediate Top in price.
Entry Zone -> This can be a better Risk/Reward zone to enter positions within the Long Zone.
Entry Zone is identified by a Pullback in Price & Volume contraction after the Long Zone is activated
Warning Zone -> One needs to be careful in this zone, no need to panic, Script will now try to find an Exit when Price Retraces towards Highs.
Warning Zone identifies weakness in the Price using Relative Strength of the current Stock (w.r.t. the Reference Symbol configured) and the severity of Pullback in Price.
Exit Zone -> are found only after transitioning to Warning Zone, this is a Zone which helps in minimising losses after a trade has gone into losses. Exit Zone is identified by making sure a local peak forms in Warning Zone. However, there are instances when Exit Zone detection can get prolonged when a local price peak is not formed soon enough. So one needs to be careful and use other strategies for exit.
------------------------------------------------------------------------------------
What is different in this Script:
The Script uses Relative Strength in combination with Pullback in Price from Highs in a Novel way.
Over-trading is avoided by ignoring Sideways price movements, using Relative Strength.
Only Trending Upward movement is detected and traded.
How to use this Indicator:
Use these 'Trading Zones' only as a reference so it can minimise your time in screening stocks.
Preferred Settings for using the Indicator:
Stick to 1-Day candles
Keep Relative Symbol as "Nifty" for Indian Stocks.
For US stocks, we can use "SPX" as the Relative Symbol.
//----------------
FEW EXAMPLES:
//----------------
ASIANPAINT
TATAMOTORS
TITAN
ITC
DIVISLAB
MARUTI
---------------------------------------------
Feedback is welcome.
Strength of Divergence Across Multiple IndicatorsOverview:
One-stop shop for all your divergence needs, including:
(1) A single metric for divergence strength across multiple indicators.
(2) Labels that make it easy to spot where the truly strong divergence is by showing the overall divergence strength value along with the number of divergent indicators. Hovering over the label shows a breakdown of each divergent indicator and its individual divergence strength value.
(3) Fully customizable, including inputs for pivot lengths, divergence types, and weights for every component of the divergence strength calculation. This allows you to quickly and easily optimize the output for any chart. Don't worry, the default settings will have you covered if you're not interested in what's going on under the hood.
The Divergence Strength Calculation:
The total divergence strength value is the sum of the divergence strengths of all indicators for which divergence was detected at a given bar. Each indicator's individual divergence strength is comprised of two basic components: (1) |ΔPrice| - the magnitude of the change in price over the divergence period (pivot-to-pivot), and (2) |ΔIndicator| - the magnitude of the change in indicator value over the divergence period.
Because different indicators' scales and volatility can vary greatly, the Δ values are expressed in terms of standard deviation to ensure that the values are meaningful and equitable across all indicators and assets/instruments/currency pairs, etc:
|ΔIndicator| = |indicator_value_1 - indicator_value_2| / 2 * StDev(indicator_series,100)
Calculation Weights:
All components of the calculation are weighted and can be modified on the Inputs page in settings (weights are simply multipliers). For example, if you think hidden divergence should carry less weight than regular divergence, you can assign it a lesser weight. Or if you think RSI divergence is worth more than OBV divergence, you can adjust their weights accordingly. List of weights:
Regular divergence weight - default = 1
Hidden divergence weight - default = 1
ΔPrice weight - default = 0.5 (multiplied by the ΔPrice component)
ΔIndicator weight - default = 1.5 (multiplied by the ΔIndicator component)
RSI weight - default = 1.1
OBV weight - default = 0.8
MACD weight - default = 0.9
STOCH weight - default = 0.9
Development for additional indicators is ongoing, as is research into the optimal weight configuration(s).
Other Inputs:
Pivot lengths - specify the number of bars before and after each pivot high/low to consider it a valid candidate for divergence.
Lookback bars and Lookback pivots - specify the number of bars or the number of pivots to look back across.
Price sources - specify separate price sources for bullish and bearish divergence
Display settings - specify how lines and labels should display, including which divergence strength values should show the largest labels. Include/exclude specific divergence types and indicators.
Please report any bugs, or let me know if you have any enhancement suggestions or requests for additional indicators.
@reees

[blackcat] L1 RSMKLevel 1
Background
This is a modified version of indicator from Markos Katsanos’ article in the March issue, “Using Relative Strength To Outperform The Market”.
Function
In “Using Relative Strength To Outperform The Market” in this issue, author Markos Katsanos presents a trading system based on a new relative strength indicator he calls RSMK. The indicator improves on the traditional relative strength indicator by separating periods of strong or weak relative strength.
I found it helpful for divergence identification.
Remarks
This is a Level 1 free and open source indicator.
Feedbacks are appreciated.